
Text: Alan Bulmer & Mike Ladle Images: Ross Baker (Tongariro River Motel)
One of the biggest challenges facing wet fly or nymph anglers fishing in rivers is to figure out what the current is doing below the surface. If you can understand this then it makes it easier to identify where the trout will be holding and hatch a plan to effectively present a fly to them. Most anglers understand that the flow velocity near the bottom is lowest, due to friction effects, and that trout tend to hold there for this reason. Similarly fish hold behind and in front of large obstructions as again there is a slackening of the current and this makes it an energetically favourable lie.
However, not many fishermen truly understand what is happening to the flow velocity as you move from the surface to the bottom of the river. Even a scientist with an in depth understanding of open channel hydraulics would struggle to predict the variations in flow velocity without a some details on the shape of the river bed channel.
The figures below show some typical velocity distributions across different river bed cross sections and the numbers indicate the percentage of maximum velocity. As you can see there is considerable variation and this is amplified as the channel becomes less regular.
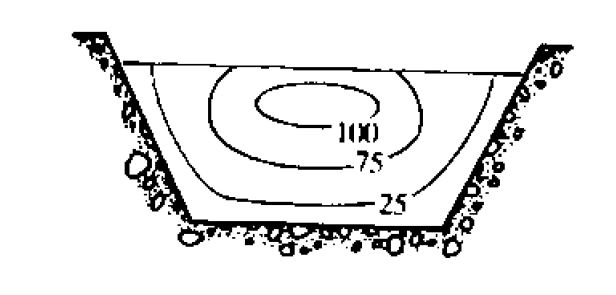
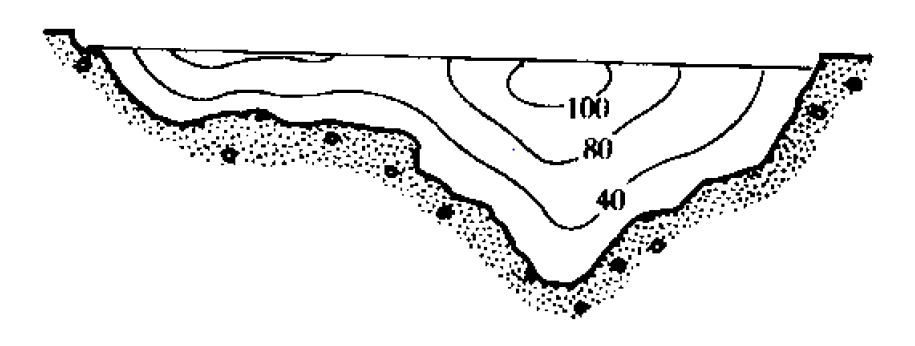
Unfortunately it is human nature to look at the surface of the river and assume that the flow velocity will be roughly the same underwater. In a turbulent rapid this is probably a reasonable assumption but in a slow moving glide it is probably not so.
However what many anglers do not realise is that flow velocity varies widely below the surface and is affected by a host of factors such as the profile and composition of the river bed and what is happening to the bottom upstream and downstream. Even in a seemingly innocuous slow glide with a regular smooth bottom there can be significant variation in flow velocity, where the velocity seems to regularly ebb and surge, at the same measurement point.
As part of his work as a fisheries ecologist Mike Ladle used to regularly monitor flow velocity and he observed this phenomenon. I’ll leave it to him to explain:-
“For many years I worked as an ecologist on chalk streams in the south of England and I often had to measure the flow / discharge of water. This entails knowing the depth and width of the water in the channel and multiplying the cross section by the speed of flow. The calculation provides an estimate of how many cubic metres per second are passing downstream. Occasionally, if I was lucky, there was a custom made gauging weir with a level concrete sill designed to permit accurate measurements of the cross section and make it easy to determine a series of more or less similar velocities across the width of the river. Of course, even with these engineered structures there are problems of measurement. In particular the friction between flowing water and the river bed slows down the flow so as a rule it is fastest near the surface and almost nil when you’re very close to the stones or sand at the bottom or near the banks. Due to this drag effect the average speed is generally found at about 60% of the way to the bottom from the surface and this is the best point to take your readings. This is typically called 0.6 of the water depth.
When we chose a stretch to take measurements it was typically at least 5 metres wide and at least 0.5 metres deep. It was always more than 100 metres downstream of any fast riffles and had tree covered banks and no weed growth. The gravel at the bottom was mostly irregular flint ranging in size from fine grit to 5 or 10cm diameter. Even if you choose a straight stretch with few river bed humps and bumps and no weed growth to speak of there was always quite a bit of variation in the current speeds across the channel. We also took care to avoid obstructions.
To estimate an average speed you can use a propeller meter to take measurements at 0.6 of the water depth, at several points across the channel. As a rule of thumb the points should be close enough to give less than 10% difference between successive readings. When you do this, however, you discover that even in apparently steady glides the flow is quite a bit faster in some places than in others. The irregular drag on your fly line and the number of ‘mends’ that you have to make show you the same sort of thing and most experienced fly anglers will have learned to compensate for these variations and so reduce the unwanted movement of the fly at the business end.
What is less obvious but may also be of some importance to an angler is a thing I noticed in the course of taking my measurements. Usually each meter reading would last for perhaps a minute and this helps to smooth out any differences over time. As I took each measurement I would watch the read out of propeller revolutions indicated on the recorder. From the speeding up and slowing down of the little propeller it was clear that such differences occurred but these changes were not usually erratic or random in nature. In fact there would often be a succession of fairly regular surges, almost like waves, each lasting for several seconds before they died down to be succeeded by the next one. Even though I was intentionally choosing to take readings in places where I hoped that the flow would be as steady as possible there were always a pattern of speeding up and slowing down”.
This is a fascinating observation that it is not entirely explained by open channel hydraulics. It is normal for the measured velocity in an open channel to vary across the channel section because of friction effects. The maximum velocity is usually found just below the surface due to the presence of secondary currents circulating from the boundaries towards the centre but this does not explain the surging effect. The fact that Mike took care to be well downstream of rapid water and to avoid obstructions which could affect flow measurement adds to the mystery.
What does this mean for anglers who are fishing below the surface? It perhaps explains why trout sometimes move towards a nymph and fail to intercept it cleanly. It also could explain why those who are sight fishing nymphs without an indicator can sometimes have trouble setting the hook. In both cases a small surge in the current velocity could have been enough to move the nymph slightly away from its previous path and fool either trout or angler.
In other cases, depending on the frequency of the surges and how they coincided with the drift of the nymph or wet fly, it could explain why some fish are not tempted to take the fly. Perhaps when one of these difficult fish is encountered it may pay to persevere longer before changing flies or increase the weight or size of the bead head slightly to mitigate current variability.
What this does show is that trout live in a dynamic environment and that we probably need to be observant and experiment more to unlock the secrets to fishing favourite sections of river. Sometimes it may also pay to move less quickly along the riverbank and try harder to catch each fish that is spotted. Food for thought?

One thought on “UNDERSTANDING FLOW BEHAVIOUR IN RIVERS”